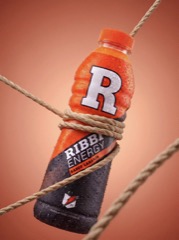
Influencer performance tracking, fully automated
The easiest way to monitor followers, engagement, and views across all your creator accounts — Ribbi tracks everything daily, so you save time and focus on growth.
Track Account Performance


Functional Highlights
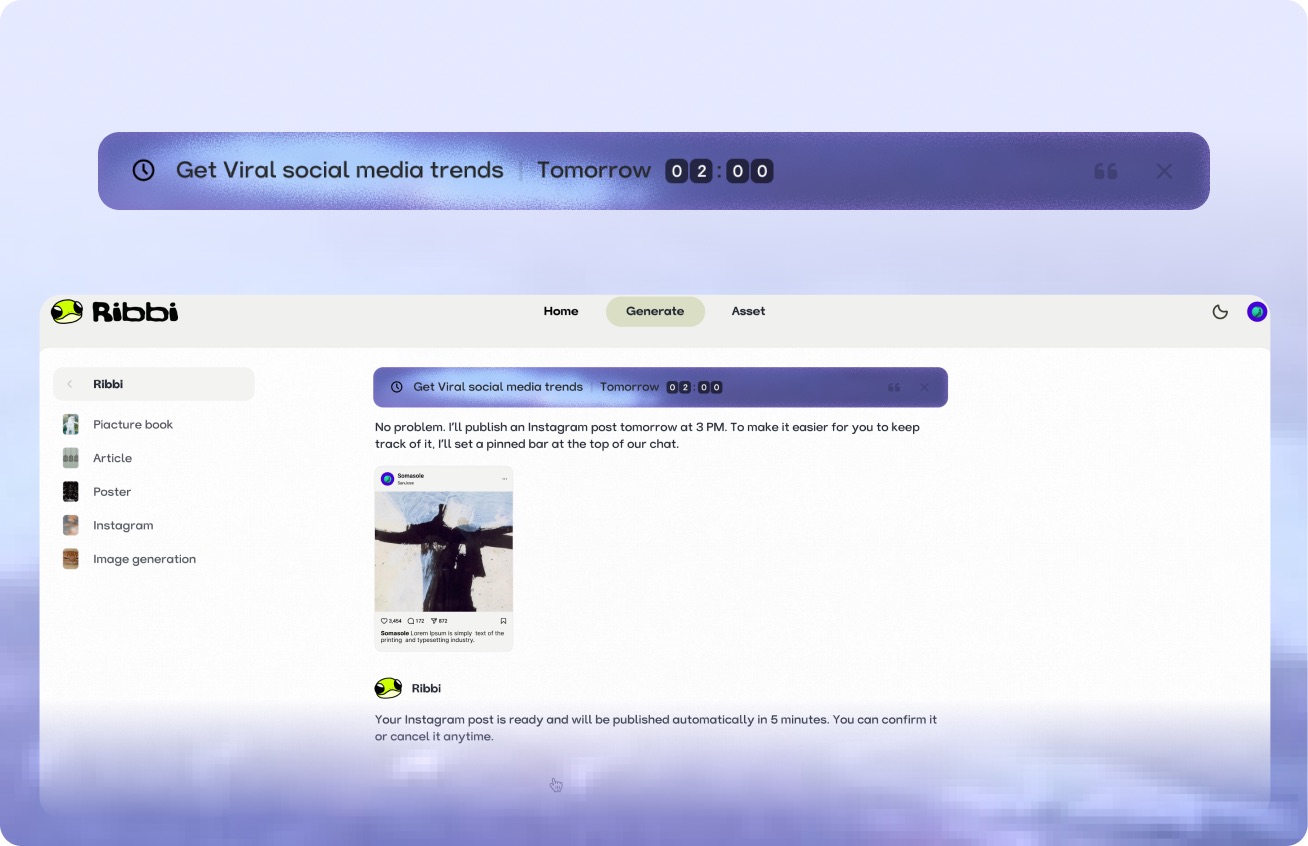
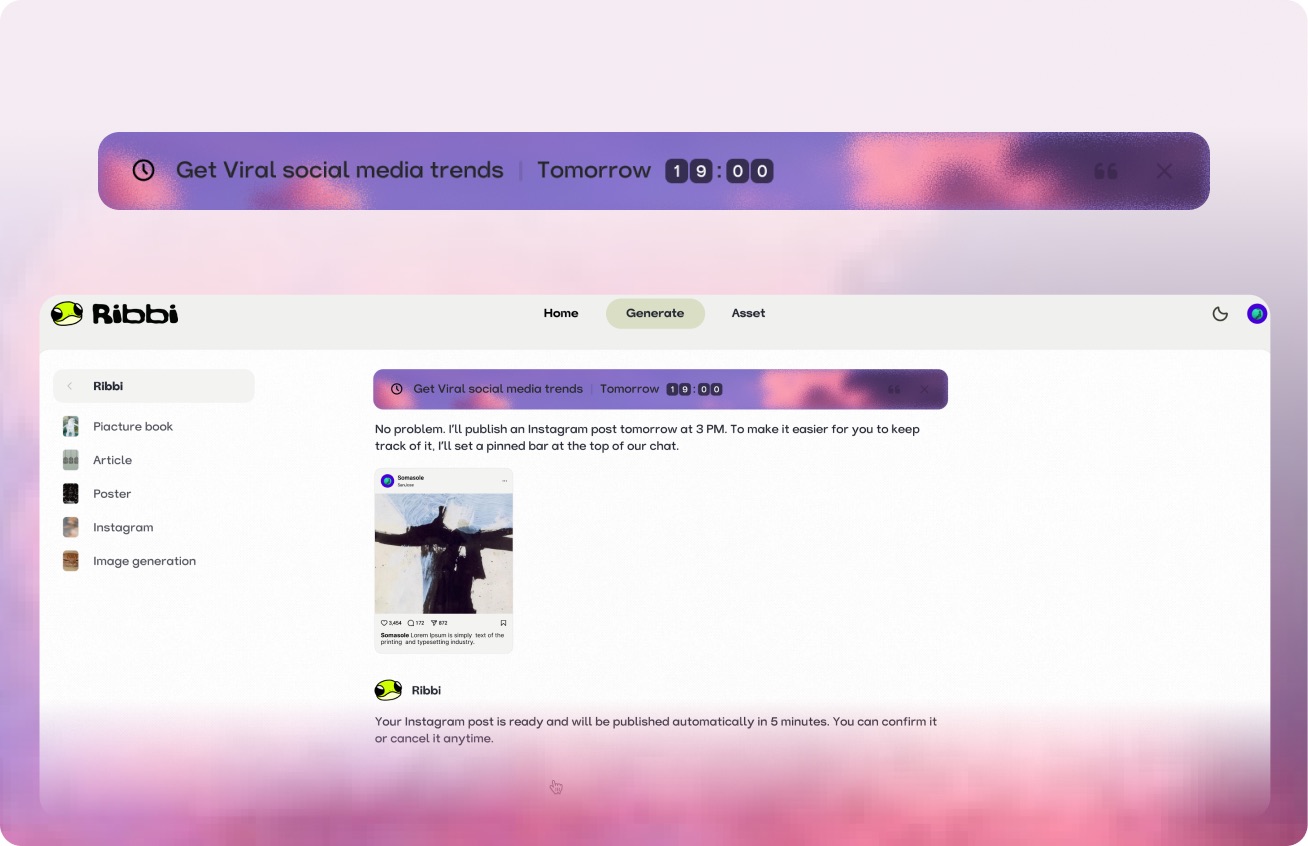
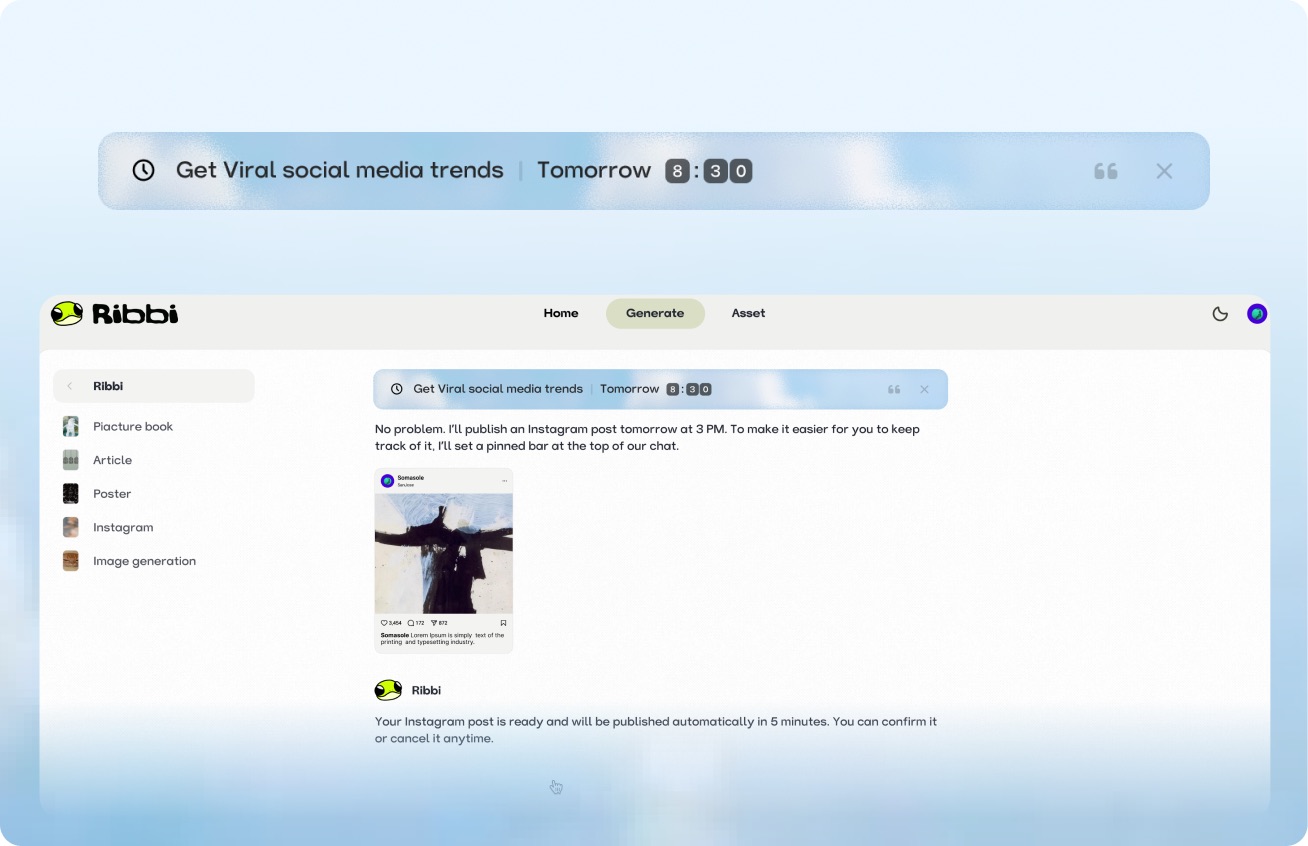
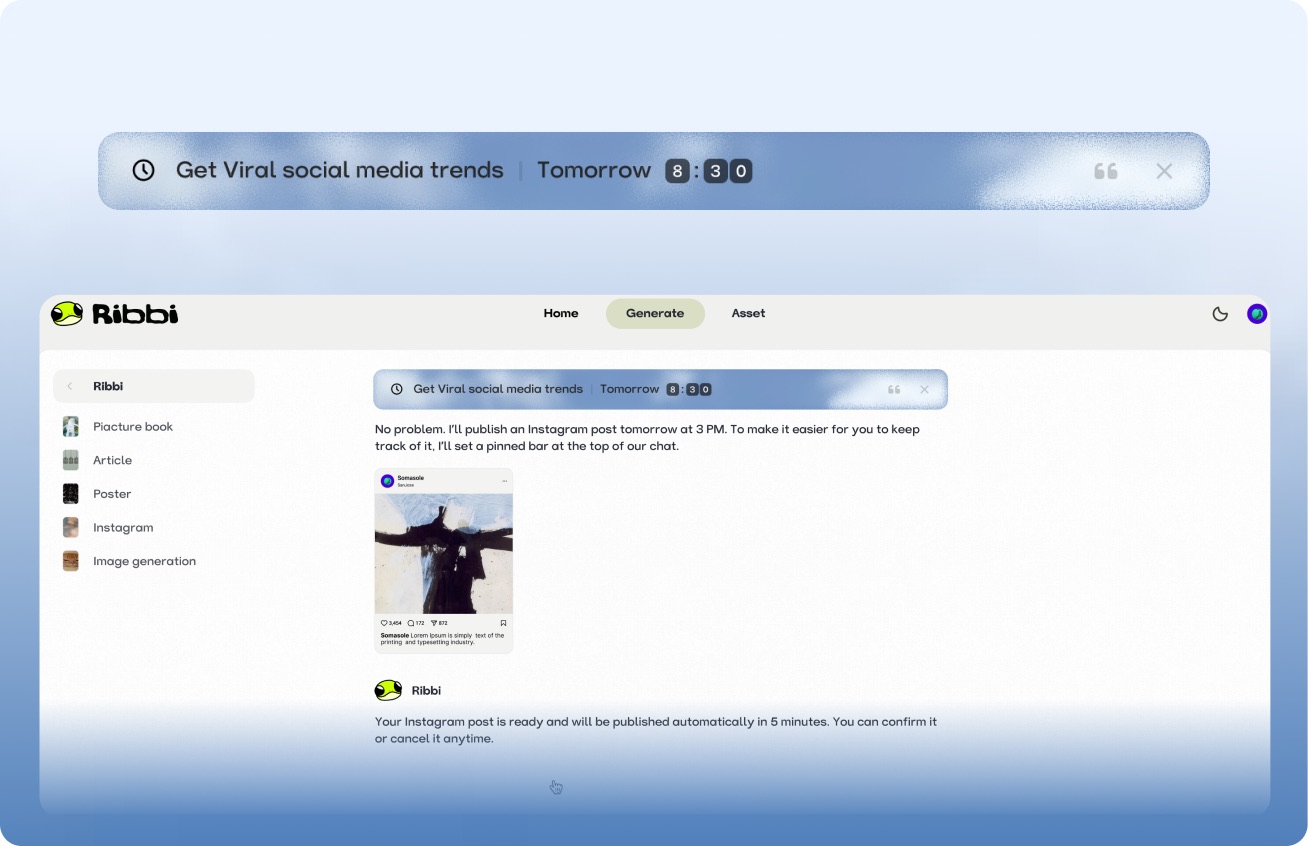
AI Timed Reminder Tool
Use "Follow Up Customers" to set up automatic notifications for timely reminders. Use "Daily Release" to trigger the creation process at regular intervals. From meeting schedules to content scheduling, once you set it, you don't need to remember again. Ribbi reminds you on time and automatically executes.
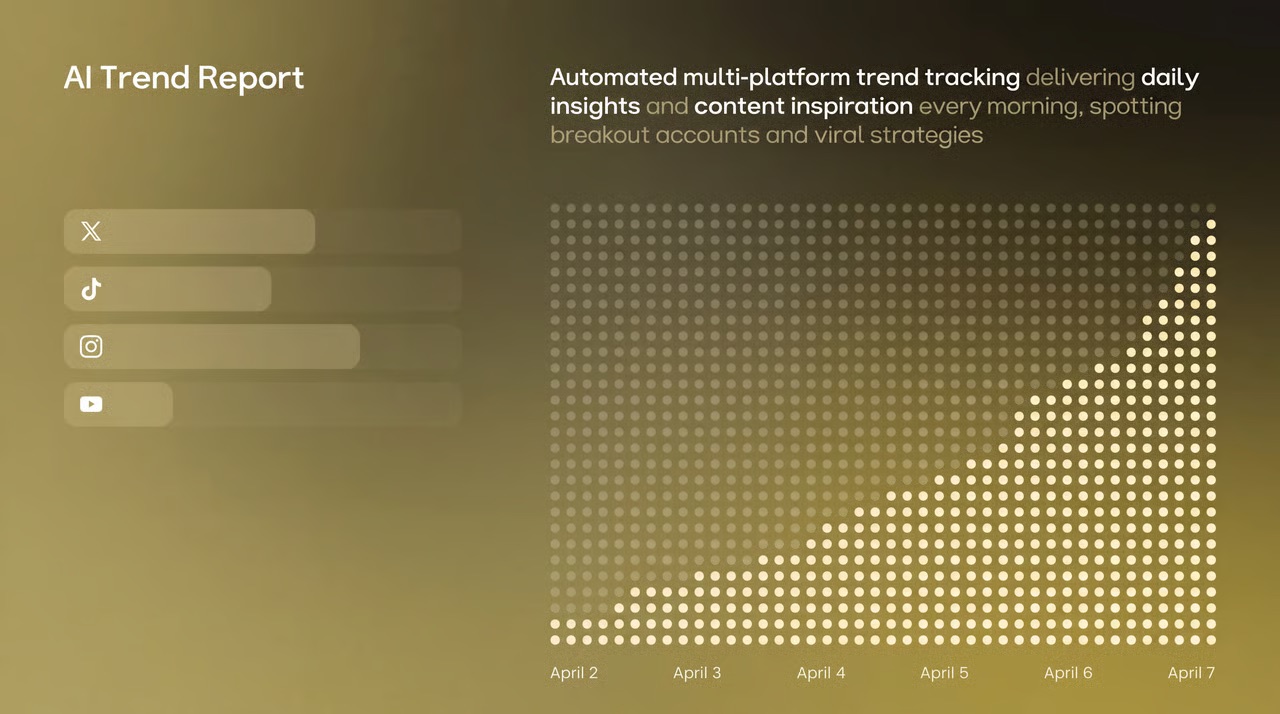
AI Hot Trend Analysis Tool
Use the "Trend Summary" Skill to automatically obtain the popularity of trending topics and keywords on TikTok, Xiaohongshu, and Instagram every day. Use the "Inspiration Analysis" Skill to determine the direction for your content, from following hot trends to setting a direction, helping you quickly find the next viral entry point.


One-click multi-platform publishing
The content will be directly synchronized and published to major social platforms such as TikTok, Instagram, YouTube, and X. Once the account is connected, the entire process from generation to distribution will be automated each time, eliminating the need to switch between multiple apps and upload one by one.
AI Skill Creation Template Library
Create a complete advertising video using the "Product Advertisement" Skill. The "Story Book" Skill can generate storyboards in one click. The "Brand Poster" Skill can produce images in just three minutes. It covers hundreds of AI creation templates such as videos, images, music, and copywriting. We continuously update popular features and cover all the creative scenarios you can imagine.


A few things you might be wondering